Our New Project
Infographic Design
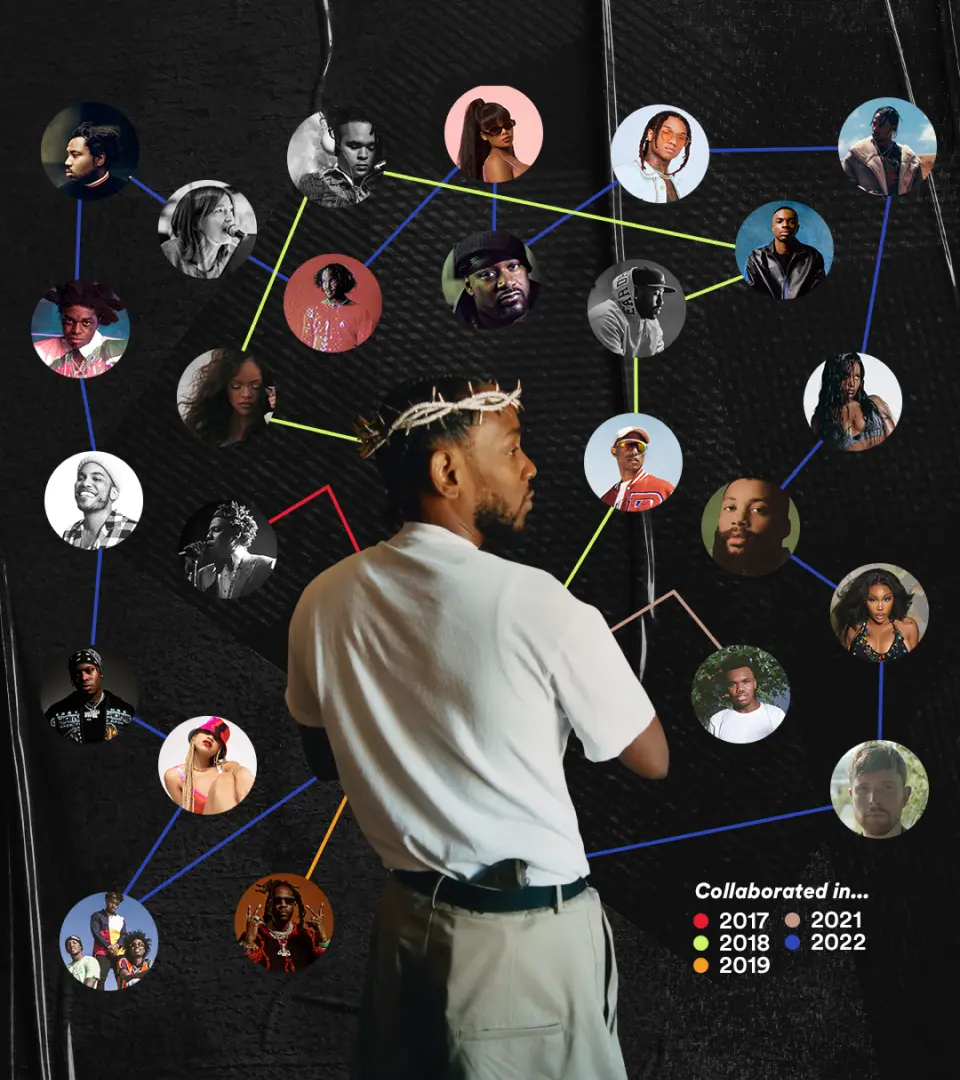
Created infographics for data visualization in reports and presentations.
Scroll
The Challenge
Making abstract concepts like 'user journey' or 'conversion funnel' feel tangible and actionable through visual storytelling.

The Work
Crafted a visual language blending flowcharts, timelines, and annotated diagrams—prioritizing clarity over decoration.
The Results
These infographics became standard templates across internal strategy decks and are now used in onboarding new team members.